Net-to-gross#
Data from HYSS for Kish Basin (https://hyss.ie/)
import os

import matplotlib.pyplot as plt
import numpy as np
import pandas as pd
import seaborn as sns
import statsmodels.api as sm
data = pd.DataFrame(
    {
        "gross": [190, 201, 219, 144, 278, 271, 120],
        "NTG": [0.68, 0.34, 0.39, 0.41, 0.41, 0.51, 0.36],
        "well": [
            "33/21-1",
            "33/21-1",
            "33/21-1",
            "33/21-1",
            "33/17-2A",
            "33/17-2A",
            "33/17-1",
        ],
        "halite": [
            "Preesall",
            "Mythop",
            "Rossall",
            "Fylde",
            "Rossall",
            "Fylde",
            "Fylde",
        ],
    }
)
data.sort_values(by=["gross", "NTG"], inplace=True)
data
| gross | NTG | well | halite | |
|---|---|---|---|---|
| 6 | 120 | 0.36 | 33/17-1 | Fylde |
| 3 | 144 | 0.41 | 33/21-1 | Fylde |
| 0 | 190 | 0.68 | 33/21-1 | Preesall |
| 1 | 201 | 0.34 | 33/21-1 | Mythop |
| 2 | 219 | 0.39 | 33/21-1 | Rossall |
| 5 | 271 | 0.51 | 33/17-2A | Fylde |
| 4 | 278 | 0.41 | 33/17-2A | Rossall |
model = sm.OLS(data["NTG"], sm.add_constant(data["gross"]))
results = model.fit()
print(results.summary())
                            OLS Regression Results
==============================================================================
Dep. Variable:                    NTG   R-squared:                       0.030
Model:                            OLS   Adj. R-squared:                 -0.165
Method:                 Least Squares   F-statistic:                    0.1524
Date:                Tue, 30 Apr 2024   Prob (F-statistic):              0.712
Time:                        14:38:23   Log-Likelihood:                 5.6884
No. Observations:                   7   AIC:                            -7.377
Df Residuals:                       5   BIC:                            -7.485
Df Model:                           1
Covariance Type:            nonrobust
==============================================================================
                 coef    std err          t      P>|t|      [0.025      0.975]
------------------------------------------------------------------------------
const          0.3734      0.184      2.025      0.099      -0.101       0.847
gross          0.0003      0.001      0.390      0.712      -0.002       0.003
==============================================================================
Omnibus:                          nan   Durbin-Watson:                   2.571
Prob(Omnibus):                    nan   Jarque-Bera (JB):                2.658
Skew:                           1.452   Prob(JB):                        0.265
Kurtosis:                       3.824   Cond. No.                         808.
==============================================================================

Notes:
[1] Standard Errors assume that the covariance matrix of the errors is correctly specified.
/mnt/Backup/Documents/Git/wind-to-hydrogen-toolkit/hydrogen-salt-storage/.venv/lib/python3.11/site-packages/statsmodels/stats/stattools.py:74: ValueWarning: omni_normtest is not valid with less than 8 observations; 7 samples were given.
  warn("omni_normtest is not valid with less than 8 observations; %i "
b, m = results.params
r = results.rsquared
g = sns.lmplot(data=data, x="gross", y="NTG")
plt.text(215, 0.65, f"$y = {m:.5f}x {b:+.5f}$\n$R^2 = {r:.5f}$", fontsize=11.5)
g.set_axis_labels("Gross halite thickness [m]", "Net-to-gross ratio")
plt.show()
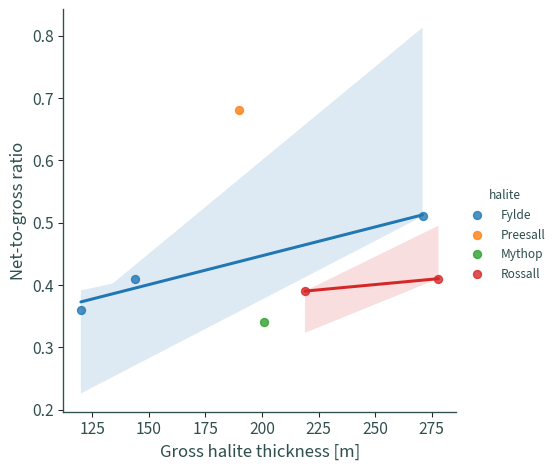
g = sns.lmplot(data=data, x="gross", y="NTG", hue="halite")
# g.set(xlim=(0, 500), ylim=(0, 1))
g.set_axis_labels("Gross halite thickness [m]", "Net-to-gross ratio")
plt.show()
data.describe()
| gross | NTG | |
|---|---|---|
| count | 7.000000 | 7.000000 |
| mean | 203.285714 | 0.442857 |
| std | 59.227568 | 0.117716 |
| min | 120.000000 | 0.340000 |
| 25% | 167.000000 | 0.375000 |
| 50% | 201.000000 | 0.410000 |
| 75% | 245.000000 | 0.460000 |
| max | 278.000000 | 0.680000 |
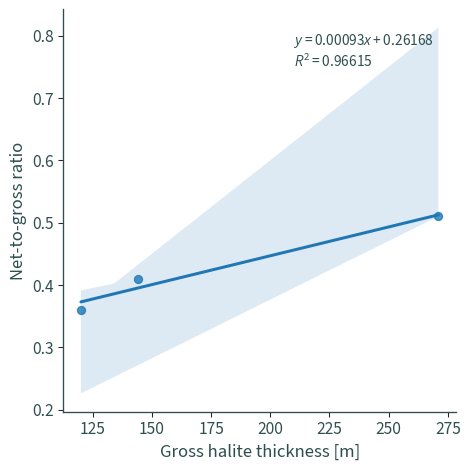
Fylde only#
fylde = data[data["halite"] == "Fylde"]
model = sm.OLS(fylde["NTG"], sm.add_constant(fylde["gross"]))
results = model.fit()
print(results.summary())
                            OLS Regression Results
==============================================================================
Dep. Variable:                    NTG   R-squared:                       0.966
Model:                            OLS   Adj. R-squared:                  0.932
Method:                 Least Squares   F-statistic:                     28.54
Date:                Wed, 28 Aug 2024   Prob (F-statistic):              0.118
Time:                        18:36:53   Log-Likelihood:                 9.1463
No. Observations:                   3   AIC:                            -14.29
Df Residuals:                       1   BIC:                            -16.10
Df Model:                           1
Covariance Type:            nonrobust
==============================================================================
                 coef    std err          t      P>|t|      [0.025      0.975]
------------------------------------------------------------------------------
const          0.2617      0.033      7.943      0.080      -0.157       0.680
gross          0.0009      0.000      5.342      0.118      -0.001       0.003
==============================================================================
Omnibus:                          nan   Durbin-Watson:                   2.731
Prob(Omnibus):                    nan   Jarque-Bera (JB):                0.328
Skew:                           0.305   Prob(JB):                        0.849
Kurtosis:                       1.500   Cond. No.                         546.
==============================================================================

Notes:
[1] Standard Errors assume that the covariance matrix of the errors is correctly specified.
/mnt/Backup/Documents/Git/wind-to-hydrogen-toolkit/hydrogen-salt-storage/.venv/lib/python3.11/site-packages/statsmodels/stats/stattools.py:74: ValueWarning: omni_normtest is not valid with less than 8 observations; 3 samples were given.
  warn("omni_normtest is not valid with less than 8 observations; %i "
b, m = results.params
r = results.rsquared
g = sns.lmplot(data=fylde, x="gross", y="NTG")
plt.text(210, 0.75, f"$y = {m:.5f}x {b:+.5f}$\n$R^2 = {r:.5f}$", fontsize=11.5)
g.set_axis_labels("Gross halite thickness [m]", "Net-to-gross ratio")
plt.show()
data.describe()
| gross | NTG | |
|---|---|---|
| count | 7.000000 | 7.000000 |
| mean | 203.285714 | 0.442857 |
| std | 59.227568 | 0.117716 |
| min | 120.000000 | 0.340000 |
| 25% | 167.000000 | 0.375000 |
| 50% | 201.000000 | 0.410000 |
| 75% | 245.000000 | 0.460000 |
| max | 278.000000 | 0.680000 |
Linear regression#
def net_to_gross(gross):
    y = m * gross + b
    return min(y, 0.75)
ntg = []
gross_thickness = np.arange(0, 700, step=1)
for x in gross_thickness:
    ntg.append(net_to_gross(x))
df = pd.DataFrame({"gross": gross_thickness, "NTG": ntg})
df["net"] = df["gross"] * df["NTG"]
df.describe()
| gross | NTG | net | |
|---|---|---|---|
| count | 700.00000 | 700.000000 | 700.000000 |
| mean | 349.50000 | 0.565548 | 229.734112 |
| std | 202.21688 | 0.161616 | 166.695894 |
| min | 0.00000 | 0.261677 | 0.000000 |
| 25% | 174.75000 | 0.423351 | 73.980840 |
| 50% | 349.50000 | 0.585026 | 204.466799 |
| 75% | 524.25000 | 0.746700 | 391.457878 |
| max | 699.00000 | 0.750000 | 524.250000 |
net_to_gross(1000)
0.75
print(f"{net_to_gross(300):.5f}")
0.53923
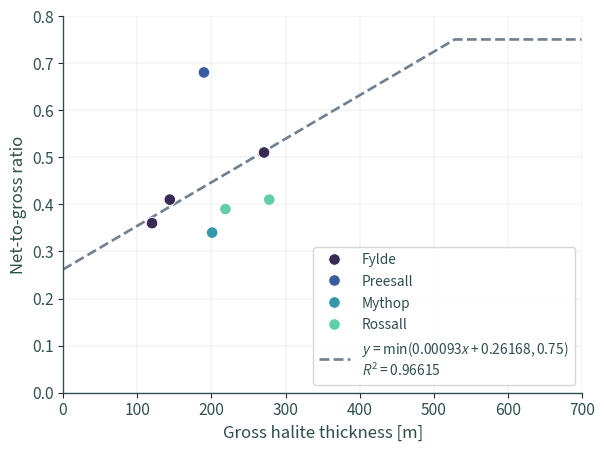
ax = sns.scatterplot(
    data=data,
    x="gross",
    y="NTG",
    hue="halite",
    zorder=3,
    palette="mako",
    s=75,
)
df.plot(
    x="gross",
    y="NTG",
    zorder=1,
    color="slategrey",
    linestyle="dashed",
    label=f"$y = \\min({m:.5f}x {b:+.5f}, 0.75)$\n$R^2 = {r:.5f}$",
    linewidth=2,
    ax=ax,
)
ax.set_xlabel("Gross halite thickness [m]")
ax.set_ylabel("Net-to-gross ratio")
sns.despine()
ax.set(xlim=(0, 700), ylim=(0, 0.8))
ax.xaxis.grid(True, linewidth=0.25)
ax.yaxis.grid(True, linewidth=0.25)
plt.legend(title=None, loc="lower right", fontsize=11.5)
plt.tight_layout()
# plt.savefig(
#     os.path.join("graphics", "Figure_3.png"),
#     format="png",
#     dpi=600,
# )
plt.show()