Cavern storage capacity#
import os

import cartopy.crs as ccrs
import contextily as cx
import geopandas as gpd
import mapclassify as mc
import matplotlib.patches as mpatches
import matplotlib.pyplot as plt
import pandas as pd
import seaborn as sns
from cartopy.mpl.ticker import LatitudeFormatter, LongitudeFormatter

# from matplotlib.lines import Line2D
from matplotlib_scalebar.scalebar import ScaleBar

from h2ss import capacity as cap
from h2ss import compare
from h2ss import data as rd
from h2ss import functions as fns
# basemap cache directory
cx.set_cache_dir(os.path.join("data", "basemaps"))
Halite data#
ds, extent = rd.kish_basin_data_depth_adjusted(
    dat_path=os.path.join("data", "kish-basin"),
    bathymetry_path=os.path.join("data", "bathymetry"),
)
xmin, ymin, xmax, ymax = extent.total_bounds
Constraints#
# exploration wells
_, wells_b = fns.constraint_exploration_well(
    data_path=os.path.join(
        "data",
        "exploration-wells",
        "Exploration_Wells_Irish_Offshore.shapezip.zip",
    )
)

# wind farms
wind_farms = fns.constraint_wind_farm(
    data_path=os.path.join(
        "data", "wind-farms", "marine-area-consent-wind.zip"
    )
)

# frequent shipping routes
_, shipping_b = fns.constraint_shipping_routes(
    data_path=os.path.join(
        "data", "shipping", "shipping_frequently_used_routes.zip"
    ),
    dat_extent=extent,
)

# shipwrecks
_, shipwrecks_b = fns.constraint_shipwrecks(
    data_path=os.path.join(
        "data", "shipwrecks", "IE_GSI_MI_Shipwrecks_IE_Waters_WGS84_LAT.zip"
    ),
    dat_extent=extent,
)

# subsea cables
_, cables_b = fns.constraint_subsea_cables(
    data_path=os.path.join("data", "subsea-cables", "KIS-ORCA.gpkg"),
    dat_extent=extent,
)
# distance from salt formation edge
edge_buffer = fns.constraint_halite_edge(dat_xr=ds)
Zones of interest#
zones, zds = fns.zones_of_interest(
    dat_xr=ds,
    constraints={"net_height": 120, "min_depth": 500, "max_depth": 2000},
)
Generate caverns#
caverns = fns.generate_caverns_hexagonal_grid(
    zones_df=zones,
    dat_extent=extent,
)
caverns = fns.cavern_dataframe(
    dat_zone=zds,
    cavern_df=caverns,
    depths={"min": 500, "min_opt": 1000, "max_opt": 1500, "max": 2000},
)
# label caverns by depth and heights
caverns = fns.label_caverns(
    cavern_df=caverns,
    heights=[120],
    depths={"min": 500, "min_opt": 1000, "max_opt": 1500, "max": 2000},
)
caverns, _ = fns.generate_caverns_with_constraints(
    cavern_df=caverns,
    exclusions={
        "wells": wells_b,
        "wind_farms": wind_farms,
        "shipwrecks": shipwrecks_b,
        "shipping": shipping_b,
        "cables": cables_b,
        "edge": edge_buffer,
    },
)
Without constraints...
Number of potential caverns: 568
------------------------------------------------------------
Excluding salt formation edges...
Number of potential caverns: 539
------------------------------------------------------------
Exclude shipping...
Number of potential caverns: 261
Caverns excluded: 51.58%
------------------------------------------------------------
Exclude wind farms...
Number of potential caverns: 218
Caverns excluded: 59.55%
------------------------------------------------------------
Exclude cables...
Number of potential caverns: 218
Caverns excluded: 59.55%
------------------------------------------------------------
Exclude wells...
Number of potential caverns: 218
Caverns excluded: 59.55%
------------------------------------------------------------
Exclude shipwrecks...
Number of potential caverns: 218
Caverns excluded: 59.55%
------------------------------------------------------------
Capacity#
Cavern volume#
caverns["cavern_total_volume"] = cap.cavern_volume(
    height=caverns["cavern_height"]
)
caverns["cavern_volume"] = cap.corrected_cavern_volume(
    v_cavern=caverns["cavern_total_volume"]
)
Mid-point temperature#
caverns["t_mid_point"] = cap.temperature_cavern_mid_point(
    height=caverns["cavern_height"], depth_top=caverns["cavern_depth"]
)
Operating pressure#
(
    caverns["p_operating_min"],
    caverns["p_operating_max"],
) = cap.pressure_operating(
    thickness_overburden=caverns["TopDepthSeabed"],
    depth_water=-caverns["Bathymetry"],
)
Hydrogen gas density#
caverns["rho_min"], caverns["rho_max"] = cap.density_hydrogen_gas(
    p_operating_min=caverns["p_operating_min"],
    p_operating_max=caverns["p_operating_max"],
    t_mid_point=caverns["t_mid_point"],
)
Working mass of hydrogen#
(
    caverns["working_mass"],
    caverns["mass_operating_min"],
    caverns["mass_operating_max"],
) = cap.mass_hydrogen_working(
    rho_h2_min=caverns["rho_min"],
    rho_h2_max=caverns["rho_max"],
    v_cavern=caverns["cavern_volume"],
)
Energy storage capacity in GWh#
caverns["capacity"] = cap.energy_storage_capacity(
    m_working=caverns["working_mass"]
)
Stats#
# proportion of working gas to total gas
caverns["working_mass_pct"] = caverns["working_mass"] / (
    caverns["working_mass"] + caverns["mass_operating_min"]
)
caverns.drop(
    columns=[
        "x",
        "y",
        "BaseDepth",
        "TopDepth",
        "TopTWT",
        "BaseDepthSeabed",
        "cavern_height",
        "cavern_total_volume",
        "cavern_volume",
    ]
).describe()
| Thickness | TopDepthSeabed | Bathymetry | NetToGross | ThicknessNet | cavern_depth | t_mid_point | p_operating_min | p_operating_max | rho_min | rho_max | working_mass | mass_operating_min | mass_operating_max | capacity | working_mass_pct | |
|---|---|---|---|---|---|---|---|---|---|---|---|---|---|---|---|---|
| count | 218.000000 | 218.000000 | 218.000000 | 218.000000 | 218.000000 | 218.000000 | 218.000000 | 2.180000e+02 | 2.180000e+02 | 218.000000 | 218.000000 | 2.180000e+02 | 2.180000e+02 | 2.180000e+02 | 218.000000 | 218.000000 |
| mean | 429.724354 | 1074.020877 | -50.338910 | 0.651980 | 283.015980 | 1154.020877 | 328.675783 | 8.061902e+06 | 2.149840e+07 | 5.608686 | 13.867715 | 3.260108e+06 | 2.213931e+06 | 5.474039e+06 | 108.634041 | 0.597511 |
| std | 72.560913 | 365.142804 | 13.127985 | 0.043909 | 69.215822 | 365.142804 | 13.692855 | 2.580140e+06 | 6.880373e+06 | 1.508555 | 3.480605 | 7.786651e+05 | 5.954757e+05 | 1.373908e+06 | 25.946851 | 0.007822 |
| min | 358.331500 | 422.745339 | -73.351486 | 0.593197 | 212.561041 | 502.745339 | 304.252950 | 3.445968e+06 | 9.189247e+06 | 2.691914 | 6.945301 | 1.678950e+06 | 1.062586e+06 | 2.741537e+06 | 55.946359 | 0.581421 |
| 25% | 384.750500 | 792.651330 | -62.446541 | 0.617639 | 237.636862 | 872.651330 | 318.124425 | 6.071888e+06 | 1.619170e+07 | 4.470379 | 11.273416 | 2.685380e+06 | 1.764604e+06 | 4.449985e+06 | 89.482842 | 0.591309 |
| 50% | 413.253450 | 1048.329146 | -53.034470 | 0.644009 | 266.138995 | 1128.329146 | 327.712343 | 7.887979e+06 | 2.103461e+07 | 5.589250 | 13.892191 | 3.277441e+06 | 2.206259e+06 | 5.483701e+06 | 109.211632 | 0.597670 |
| 75% | 446.045600 | 1353.385847 | -41.985056 | 0.674348 | 300.789815 | 1433.385847 | 339.151969 | 1.004202e+07 | 2.677871e+07 | 6.804421 | 16.649315 | 3.886101e+06 | 2.685927e+06 | 6.572028e+06 | 129.493525 | 0.603458 |
| max | 822.710300 | 1900.680682 | -18.320551 | 0.750000 | 617.032725 | 1980.680682 | 359.675526 | 1.382934e+07 | 3.687824e+07 | 8.691559 | 20.764429 | 4.765555e+06 | 3.430842e+06 | 8.196397e+06 | 158.798899 | 0.612412 |
# fixed values
caverns[["cavern_height", "cavern_total_volume", "cavern_volume"]].iloc[0]
cavern_height             120.000000
cavern_total_volume    563903.723294
cavern_volume          394732.606306
Name: 0, dtype: float64
# totals
caverns[
    [
        "cavern_volume",
        "working_mass",
        "capacity",
        "mass_operating_min",
        "mass_operating_max",
    ]
].sum()
cavern_volume         8.605171e+07
working_mass          7.107035e+08
capacity              2.368222e+04
mass_operating_min    4.826370e+08
mass_operating_max    1.193341e+09
dtype: float64
# compare with Ireland's electricity demand in 2050 (Deane, 2021)
compare.electricity_demand_ie(data=caverns["capacity"])
Energy capacity as a percentage of Ireland's electricity demand
in 2050 (84–122 TWh electricity), assuming a conversion efficiency
of 50%: 9.71–14.10%
Energy capacity as a percentage of Ireland's hydrogen demand
in 2050, assuming it is 17% of the electricity demand
(84–122 TWh electricity): 114.19–165.84%
# compare with Ireland's hydrogen demand in 2050
compare.hydrogen_demand_ie(data=caverns["capacity"])
Energy capacity as a percentage of Ireland's domestic hydrogen
demand in 2050 (4.6–39 TWh hydrogen): 60.72–514.83%
Energy capacity as a percentage of Ireland's domestic and
non-domestic hydrogen demand in 2050 (19.8–74.6 TWh hydrogen): 31.75–119.61%
# total capacity at various depth/height combinations
s = caverns.groupby(["depth", "halite"], sort=False)[["capacity"]].sum()
s["%"] = s["capacity"] / caverns[["capacity"]].sum().iloc[0] * 100
s
| capacity | % | ||
|---|---|---|---|
| depth | halite | ||
| 1,000 - 1,500 | Rossall | 11585.091442 | 48.918940 |
| 500 - 1,000 | Rossall | 3884.416135 | 16.402246 |
| 1,500 - 2,000 | Rossall | 4630.799533 | 19.553907 |
| 1,000 - 1,500 | Preesall | 102.631996 | 0.433371 |
| 500 - 1,000 | Preesall | 1353.174027 | 5.713881 |
| 1,500 - 2,000 | Preesall | 151.843643 | 0.641171 |
| 1,000 - 1,500 | Fylde | 574.503947 | 2.425887 |
| 1,500 - 2,000 | Fylde | 597.204799 | 2.521743 |
| 500 - 1,000 | Fylde | 802.555520 | 3.388852 |
s.groupby("depth").sum()[["capacity"]]
| capacity | |
|---|---|
| depth | |
| 1,000 - 1,500 | 12262.227385 |
| 1,500 - 2,000 | 5379.847975 |
| 500 - 1,000 | 6040.145681 |
s.groupby("halite").sum()[["capacity"]]
| capacity | |
|---|---|
| halite | |
| Fylde | 1974.264266 |
| Preesall | 1607.649665 |
| Rossall | 20100.307110 |
# number of caverns
s = caverns.groupby(["depth", "halite"], sort=False)[["capacity"]].count()
s["%"] = s["capacity"] / len(caverns) * 100
s
| capacity | % | ||
|---|---|---|---|
| depth | halite | ||
| 1,000 - 1,500 | Rossall | 99 | 45.412844 |
| 500 - 1,000 | Rossall | 49 | 22.477064 |
| 1,500 - 2,000 | Rossall | 32 | 14.678899 |
| 1,000 - 1,500 | Preesall | 1 | 0.458716 |
| 500 - 1,000 | Preesall | 17 | 7.798165 |
| 1,500 - 2,000 | Preesall | 1 | 0.458716 |
| 1,000 - 1,500 | Fylde | 5 | 2.293578 |
| 1,500 - 2,000 | Fylde | 4 | 1.834862 |
| 500 - 1,000 | Fylde | 10 | 4.587156 |
s.groupby("depth").sum()[["capacity"]]
| capacity | |
|---|---|
| depth | |
| 1,000 - 1,500 | 105 |
| 1,500 - 2,000 | 37 |
| 500 - 1,000 | 76 |
s.groupby("halite").sum()[["capacity"]]
| capacity | |
|---|---|
| halite | |
| Fylde | 19 |
| Preesall | 19 |
| Rossall | 180 |
compare.distance_from_pipeline(
    caverns, os.path.join("data", "pipelines", "pipelines.zip")
)
Distance to nearest pipeline from caverns: 13.65–38.10 km (mean: 18.47 km)
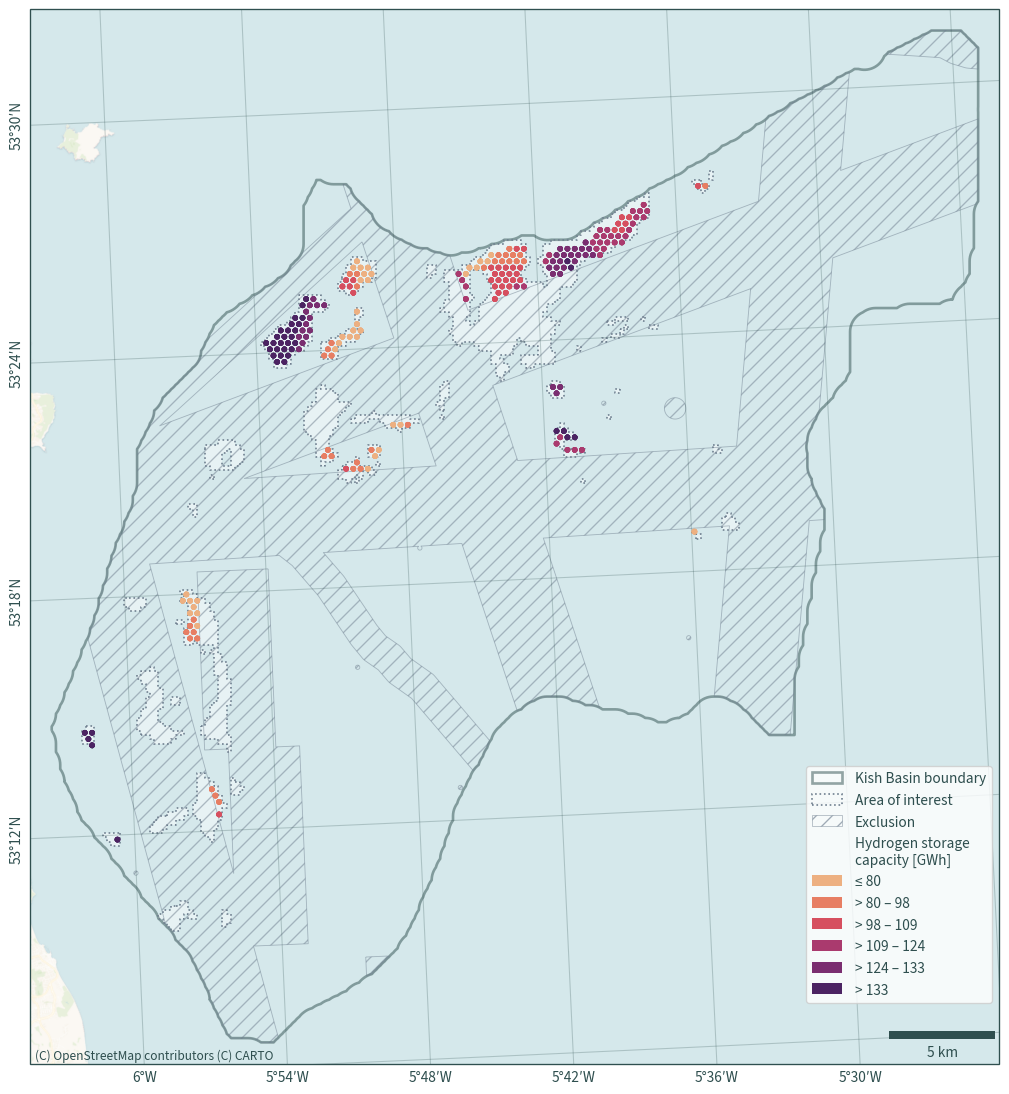
Map#
# create exclusion buffer
buffer = pd.concat([wells_b, shipwrecks_b, shipping_b, cables_b]).dissolve()
def plot_map_alt(
    dat_xr,
    cavern_df,
    zones_gdf,
    classes,
    # quantity="capacity",
    # quantity_label="Hydrogen storage \ncapacity [GWh]",
    # top_depth=True,
    fontsize=11.5,
):
    """Helper function to plot caverns within the zones of interest"""
    plt.figure(figsize=(20, 11.5))
    axis1 = plt.axes(projection=ccrs.epsg(rd.CRS))
    legend_handles1 = []
    classes = sorted(classes)

    # halite boundary - use buffering to smooth the outline
    shape = rd.halite_shape(dat_xr=dat_xr).buffer(1000).buffer(-1000)
    shape.plot(
        ax=axis1,
        edgecolor="darkslategrey",
        color="none",
        linewidth=2,
        alpha=0.5,
        zorder=2,
    )
    legend_handles1.append(
        mpatches.Patch(
            facecolor="none",
            linewidth=2,
            edgecolor="darkslategrey",
            label="Kish Basin boundary",
            alpha=0.5,
        )
    )

    zones_gdf.plot(
        ax=axis1, zorder=1, linewidth=0, facecolor="white", alpha=0.45
    )
    zones_gdf.plot(
        ax=axis1,
        zorder=2,
        edgecolor="slategrey",
        linestyle="dotted",
        linewidth=1.25,
        facecolor="none",
    )
    legend_handles1.append(
        mpatches.Patch(
            facecolor="none",
            linestyle="dotted",
            edgecolor="slategrey",
            label="Area of interest",
            linewidth=1.25,
        )
    )

    pd.concat([buffer, wind_farms]).dissolve().clip(shape).plot(
        ax=axis1,
        facecolor="none",
        linewidth=0.65,
        edgecolor="slategrey",
        zorder=2,
        alpha=0.5,
        hatch="//",
    )
    legend_handles1.append(
        mpatches.Patch(
            facecolor="none",
            hatch="//",
            edgecolor="slategrey",
            label="Exclusion",
            alpha=0.65,
            linewidth=0.5,
        )
    )

    legend_handles1.append(
        mpatches.Patch(
            label="Hydrogen storage \ncapacity [GWh]", visible=False
        )
    )

    colours = [int(n * 255 / (len(classes) - 1)) for n in range(len(classes))]
    for n, y in enumerate(colours):
        if n == 0:
            # c = cavern_df[cavern_df["capacity"] < classes[0]]
            label1 = f"≤ {classes[0]:.0f}"
        elif n == len(colours) - 1:
            # c = cavern_df[cavern_df["capacity"] >= classes[-2]]
            label1 = f"> {classes[-2]:.0f}"
        else:
            # c = cavern_df[
            #     (cavern_df["capacity"] >= classes[n - 1])
            #     & (cavern_df["capacity"] < classes[n])
            # ]
            label1 = f"> {classes[n - 1]:.0f} – {classes[n]:.0f}"
        # if top_depth:
        #     for df, markersize in zip(
        #         [
        #             c[c["depth"] == "500 - 1,000"],
        #             c[c["depth"] == "1,000 - 1,500"],
        #             c[c["depth"] == "1,500 - 2,000"],
        #         ],
        #         [20, 50, 20],
        #     ):
        #         if len(df) > 0:
        #             df.centroid.plot(
        #                 ax=axis1,
        #                 zorder=3,
        #                 linewidth=0,
        #                 marker=".",
        #                 markersize=markersize,
        #                 color=sns.color_palette("flare", 256)[y],
        #             )
        # else:
        gpd.GeoDataFrame(cavern_df, geometry=cavern_df.centroid).plot(
            ax=axis1,
            scheme="UserDefined",
            classification_kwds={"bins": classes},
            column="capacity",
            zorder=3,
            marker=".",
            cmap="flare",
            markersize=40,
        )
        legend_handles1.append(
            mpatches.Patch(
                facecolor=sns.color_palette("flare", 256)[y], label=label1
            )
        )

    # if top_depth:
    #     legend_handles1.append(
    #         mpatches.Patch(label="Cavern top depth [m]", visible=False)
    #     )
    #     for markersize, label1 in zip(
    #         [6, 3], ["1,000–1,500", "500–1,000 or \n1,500–2,000"]
    #     ):
    #         legend_handles1.append(
    #             Line2D(
    #                 [0],
    #                 [0],
    #                 marker=".",
    #                 linewidth=0,
    #                 label=label1,
    #                 color="darkslategrey",
    #                 markersize=markersize,
    #             )
    #         )

    plt.xlim(shape.bounds["minx"][0] - 1000, shape.bounds["maxx"][0] + 1000)
    plt.ylim(shape.bounds["miny"][0] - 1000, shape.bounds["maxy"][0] + 1000)

    basemap = cx.providers.CartoDB.VoyagerNoLabels
    cx.add_basemap(
        axis1, crs=rd.CRS, source=basemap, zoom=12, attribution=False
    )
    axis1.text(
        shape.bounds["minx"][0] - 800,
        shape.bounds["miny"][0] - 800,
        basemap["attribution"],
        fontsize=10,
    )

    axis1.gridlines(
        draw_labels={"bottom": "x", "left": "y"},
        alpha=0.25,
        color="darkslategrey",
        xlabel_style={"fontsize": fontsize},
        ylabel_style={"fontsize": fontsize, "rotation": 89.9},
        xformatter=LongitudeFormatter(auto_hide=False, dms=True),
        yformatter=LatitudeFormatter(auto_hide=False, dms=True),
    )
    axis1.add_artist(
        ScaleBar(
            1,
            box_alpha=0,
            location="lower right",
            color="darkslategrey",
            width_fraction=0.0075,
            font_properties={"size": fontsize},
        )
    )
    plt.legend(
        loc="lower right",
        bbox_to_anchor=(1, 0.05),
        handles=legend_handles1,
        fontsize=fontsize,
    )
    plt.title(None)

    plt.tight_layout()
    # plt.savefig(
    #     os.path.join("graphics", "Figure_8.png"),
    #     format="png",
    #     dpi=600,
    # )
    plt.show()
plot_map_alt(
    ds, caverns, zones, list(mc.Quantiles(caverns["capacity"], k=6).bins)
)